Note
Go to the end to download the full example code.
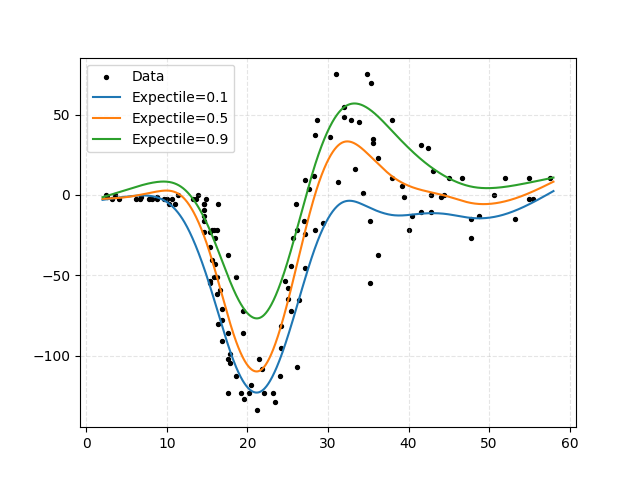
Univariate spline with expectiles#
Plot a univariate spline with expectiles.
import matplotlib.pyplot as plt
import numpy as np
from generalized_additive_models import ExpectileGAM, Spline
from generalized_additive_models.datasets import load_mcycle

# Create data
df = load_mcycle()
X, y = df[["times"]], df["accel"]

# To evaluate the model on
x_smooth = np.linspace(2, 58, num=2**10)

# Plot the data
plt.scatter(X, y, label="Data", color="black", s=8)

for expectile in [0.1, 0.5, 0.9]:
    # Create a model
    gam = ExpectileGAM(Spline("times", penalty=5e-1), expectile=expectile)
    gam.fit(X, y)

    # To fit quantiles insteada, use
    # gam.fit_quantile(X, y, quantile=quantile)

    # Predict on a smooth grid
    y_smooth = gam.predict(x_smooth[:, np.newaxis])
    plt.plot(x_smooth, y_smooth, label=f"Expectile={expectile}")

# Create a plot
plt.grid(True, ls="--", alpha=0.33)
plt.legend()
plt.show()
Total running time of the script: (0 minutes 0.073 seconds)