Diagnostics plots#
Import packages.
[1]:
import matplotlib.pyplot as plt
import numpy as np
from sklearn.datasets import load_diabetes

from generalized_additive_models import GAM, Categorical, Spline
/home/docs/checkouts/readthedocs.org/user_builds/generalized-additive-models/envs/latest/lib/python3.11/site-packages/generalized_additive_models/__init__.py:116: UserWarning:
Thank you for using generalized-additive-models, version 0.4.3.
Until version 1.0.0 is released, the package and API should be considered unstable.
You are welcome to use the package. Report bugs and join the discussion on GitHub:
https://github.com/tommyod/generalized-additive-models
  warnings.warn(message)
Load data.
[2]:
data = load_diabetes(as_frame=True)
df = data.data
y = data.target

# Code the "sex" variable as strings
df = df.assign(sex=lambda df: np.where(df.sex < 0, "Male", "Female"))

df.sample(5)
[2]:
| age | sex | bmi | bp | s1 | s2 | s3 | s4 | s5 | s6 | |
|---|---|---|---|---|---|---|---|---|---|---|
| 326 | 0.045341 | Female | -0.008362 | -0.033213 | -0.007073 | 0.001191 | -0.039719 | 0.034309 | 0.029935 | 0.027917 |
| 386 | 0.019913 | Male | -0.040696 | -0.015999 | -0.008449 | -0.017598 | 0.052322 | -0.039493 | -0.030748 | 0.003064 |
| 68 | 0.038076 | Female | -0.029918 | -0.040099 | -0.033216 | -0.024174 | -0.010266 | -0.002592 | -0.012909 | 0.003064 |
| 363 | -0.049105 | Female | -0.024529 | 0.000079 | -0.046975 | -0.028245 | -0.065491 | 0.028405 | 0.019196 | 0.011349 |
| 85 | 0.045341 | Male | 0.071397 | 0.001215 | -0.009825 | -0.001001 | 0.015505 | -0.039493 | -0.041176 | -0.071494 |
[3]:
terms = Spline("age") + Spline("bmi") + Spline("bp") + Categorical("sex")
gam = GAM(terms).fit(df, y)
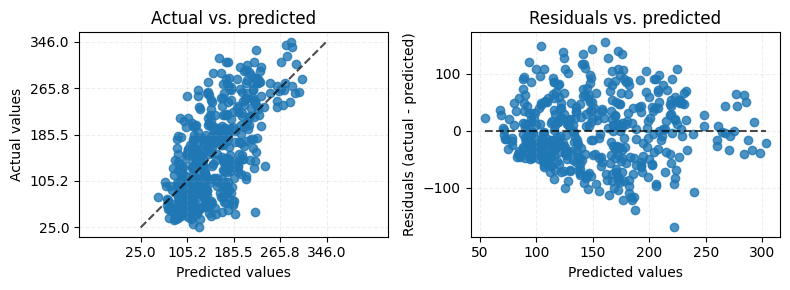
Diagnostics with sklearn#
[4]:
from sklearn.metrics import PredictionErrorDisplay

fig, (ax1, ax2) = plt.subplots(1, 2, figsize=(8, 3))

ax1.set_title("Actual vs. predicted")
PredictionErrorDisplay.from_estimator(gam, df, y, ax=ax1, kind="actual_vs_predicted")
ax1.grid(True, ls="--", alpha=0.2)

ax2.set_title("Residuals vs. predicted")
PredictionErrorDisplay.from_estimator(gam, df, y, ax=ax2, kind="residual_vs_predicted")
ax2.grid(True, ls="--", alpha=0.2)

fig.tight_layout()
plt.show()
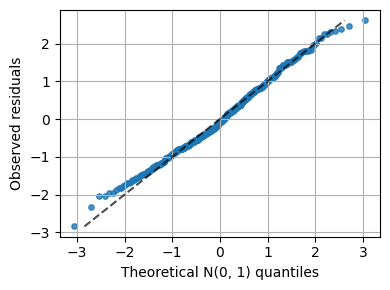
GAM diagnostics plots#
[5]:
from generalized_additive_models.inspection import QQDisplay


fig, ax = plt.subplots(1, 1, figsize=(4, 3))

display = QQDisplay.from_estimator(
    gam, df, y, residuals="deviance", method="normal", ax=ax
)

ax.grid(True)
fig.tight_layout()
plt.show()