Example: salaries#
Import packages.
[1]:
%load_ext autoreload
%autoreload 2
[2]:
import matplotlib.pyplot as plt
import pandas as pd
import numpy as np

from generalized_additive_models import GAM, Categorical, Spline
/home/docs/checkouts/readthedocs.org/user_builds/generalized-additive-models/envs/latest/lib/python3.11/site-packages/generalized_additive_models/__init__.py:116: UserWarning:
Thank you for using generalized-additive-models, version 0.4.3.
Until version 1.0.0 is released, the package and API should be considered unstable.
You are welcome to use the package. Report bugs and join the discussion on GitHub:
https://github.com/tommyod/generalized-additive-models
  warnings.warn(message)
Load data.
[3]:
from generalized_additive_models.datasets import load_salaries

df = load_salaries()
y = df["salary"].values
df.sample(5, random_state=42)
[3]:
| age | years_formal_relevant_education | years_relevant_work_experience | sector | geographical_location | work_domain | num_colleagues | salary | happy_with_salary | |
|---|---|---|---|---|---|---|---|---|---|
| 1656 | 28.0 | 5.0 | 2.0 | in-house, privat sektor | Trøndelag | data science | 100 - 500 | 850000.0 | 1 |
| 1412 | 53.0 | 4.0 | 28.0 | konsulent | Oslo | arkitektur | 1.000 - 10.000 | 1300000.0 | 1 |
| 480 | 28.0 | 3.0 | 4.0 | in-house, privat sektor | Oslo | fullstack | 10 - 50 | 810000.0 | 1 |
| 617 | 33.0 | 5.0 | 7.0 | in-house, privat sektor | Rogaland | automatisering | 100 - 500 | 720000.0 | 0 |
| 1075 | 43.0 | 3.0 | 18.0 | in-house, privat sektor | Oslo | fullstack | 10 - 50 | 1200000.0 | 1 |
Create sklearn pipeline#
[4]:
from sklearn.dummy import DummyRegressor
from sklearn.pipeline import Pipeline
from sklearn.compose import ColumnTransformer
from sklearn.preprocessing import OneHotEncoder


numerical_features = [
    "age",
    "years_formal_relevant_education",
    "years_relevant_work_experience",
]

categorical_features = [
    "sector",
    "geographical_location",
    "work_domain",
    "num_colleagues",
]


pipe_union = ColumnTransformer(
    [
        ("numerical", "passthrough", numerical_features),
        ("categorical", OneHotEncoder(), categorical_features),
    ]
)

pipeline = Pipeline([("transform", pipe_union), ("model", DummyRegressor())])

pipeline
[4]:
Pipeline(steps=[('transform',
                 ColumnTransformer(transformers=[('numerical', 'passthrough',
                                                  ['age',
                                                   'years_formal_relevant_education',
                                                   'years_relevant_work_experience']),
                                                 ('categorical',
                                                  OneHotEncoder(),
                                                  ['sector',
                                                   'geographical_location',
                                                   'work_domain',
                                                   'num_colleagues'])])),
                ('model', DummyRegressor())])
In a Jupyter environment, please rerun this cell to show the HTML representation or trust the notebook. On GitHub, the HTML representation is unable to render, please try loading this page with nbviewer.org.
Parameters
| steps | [('transform', ...), ('model', ...)] | |
| transform_input | None | |
| memory | None | |
| verbose | False |
Parameters
| transformers | [('numerical', ...), ('categorical', ...)] | |
| remainder | 'drop' | |
| sparse_threshold | 0.3 | |
| n_jobs | None | |
| transformer_weights | None | |
| verbose | False | |
| verbose_feature_names_out | True | |
| force_int_remainder_cols | 'deprecated' |
['age', 'years_formal_relevant_education', 'years_relevant_work_experience']
passthrough
['sector', 'geographical_location', 'work_domain', 'num_colleagues']
Parameters
| categories | 'auto' | |
| drop | None | |
| sparse_output | True | |
| dtype | <class 'numpy.float64'> | |
| handle_unknown | 'error' | |
| min_frequency | None | |
| max_categories | None | |
| feature_name_combiner | 'concat' |
Parameters
| strategy | 'mean' | |
| constant | None | |
| quantile | None |
Model: dummy#
[5]:
from sklearn.model_selection import cross_validate

pipeline.steps[-1] = ("model", DummyRegressor())

results_dummy = cross_validate(pipeline, df, y, cv=10, scoring="r2")

(results_dummy["test_score"].mean(), results_dummy["test_score"].std())
[5]:
(np.float64(-0.002069391817402666), np.float64(0.0020411018924504382))
Model: linear#
[6]:
from sklearn.linear_model import Ridge

FEATURES = ["years_formal_relevant_education", "years_relevant_work_experience"]

pipeline.steps[-1] = ("model", Ridge())

results_linear = cross_validate(pipeline, df, y, cv=10, scoring="r2")

(results_linear["test_score"].mean(), results_linear["test_score"].std())
[6]:
(np.float64(0.40939704510904873), np.float64(0.04669924402437911))
Model: boosting#
[7]:
from sklearn.ensemble import GradientBoostingRegressor

pipeline.steps[-1] = ("model", GradientBoostingRegressor())

results_boosting = cross_validate(pipeline, df, y, cv=10, scoring="r2")

(results_boosting["test_score"].mean(), results_boosting["test_score"].std())
[7]:
(np.float64(0.47499099061792344), np.float64(0.056681382583350245))
Create a GAM#
[8]:
penalty_spline = 10
penalty_categorical = 5

terms = (
    Spline("age", penalty=penalty_spline, num_splines=8)
    + Spline("years_formal_relevant_education", penalty=penalty_spline, num_splines=8)
    + Spline("years_relevant_work_experience", penalty=penalty_spline, num_splines=8)
    + Categorical("sector", penalty=penalty_categorical)
    + Categorical("geographical_location", penalty=penalty_categorical)
    + Categorical("work_domain", penalty=penalty_categorical)
)

model = GAM(terms, link="identity")

results_gam = cross_validate(model, df, y, cv=10, scoring="r2")

(results_gam["test_score"].mean(), results_gam["test_score"].std())
[8]:
(np.float64(0.45526957974150833), np.float64(0.04956605494077018))
[9]:
model.fit(df, y)
model.summary()
| Property | Value |
|--------------------|-----------------|
| Model | GAM |
| Link | Identity() |
| Distribution | Normal |
| Scale | 45866971606.880 |
| GCV | 46635029130.767 |
| Explained deviance | 0.471 |
| Term | Coefs | Edof |
|-----------------------------------------|---------|--------|
| Spline(age) | 8 | 2.912 |
| Spline(years_formal_relevant_education) | 8 | 3.118 |
| Spline(years_relevant_work_experience) | 8 | 2.831 |
| Categorical(sector) | 4 | 2.898 |
| Categorical(geographical_location) | 12 | 10.232 |
| Categorical(work_domain) | 16 | 13.769 |
| Intercept() | 1 | 1 |
| Term | Coef | Coef std |
|-----------------------------------------------------------|------------|------------|
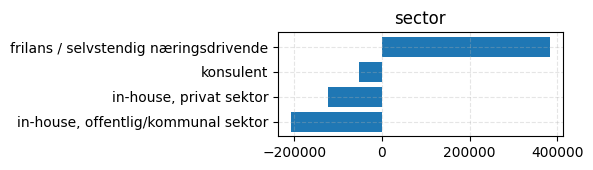
| Categorical(sector=frilans / selvstendig næringsdrivende) | 383046 | 53367.4 |
| Categorical(sector=in-house, offentlig/kommunal sektor) | -207806 | 49616.1 |
| Categorical(sector=in-house, privat sektor) | -122866 | 48924.1 |
| Categorical(sector=konsulent) | -52373.6 | 49029.9 |
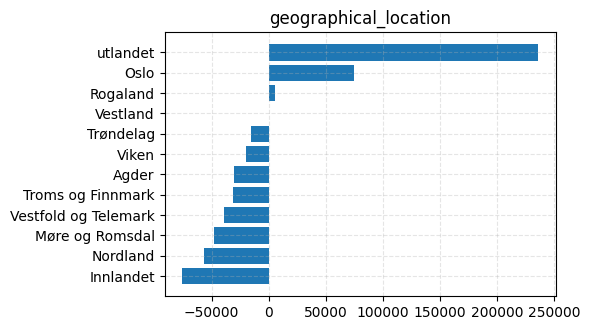
| Categorical(geographical_location=Agder) | -30375.5 | 35499.9 |
| Categorical(geographical_location=Innlandet) | -75621.1 | 37953.4 |
| Categorical(geographical_location=Møre og Romsdal) | -47979.9 | 37400.3 |
| Categorical(geographical_location=Nordland) | -56677.1 | 40565.8 |
| Categorical(geographical_location=Oslo) | 74679.9 | 29294.5 |
| Categorical(geographical_location=Rogaland) | 5385.58 | 33041.4 |
| Categorical(geographical_location=Troms og Finnmark) | -30972.2 | 39288.2 |
| Categorical(geographical_location=Trøndelag) | -15617.6 | 32180 |
| Categorical(geographical_location=Vestfold og Telemark) | -39156.8 | 34465.2 |
| Categorical(geographical_location=Vestland) | 436.03 | 31514.8 |
| Categorical(geographical_location=Viken) | -20193.6 | 32783.5 |
| Categorical(geographical_location=utlandet) | 236092 | 51833.6 |
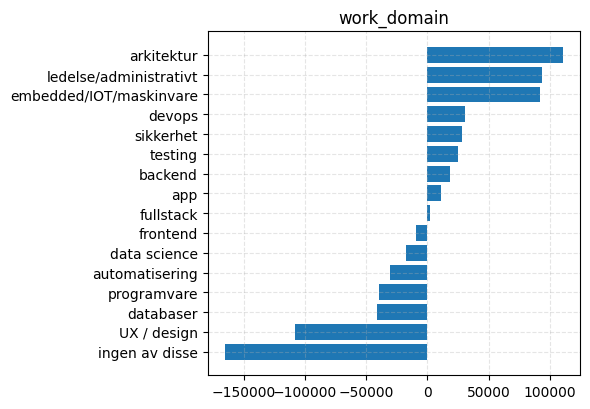
| Categorical(work_domain=UX / design) | -108507 | 38271 |
| Categorical(work_domain=app) | 11304.4 | 35086.4 |
| Categorical(work_domain=arkitektur) | 110786 | 33194 |
| Categorical(work_domain=automatisering) | -30254 | 36508 |
| Categorical(work_domain=backend) | 18303.3 | 26974.1 |
| Categorical(work_domain=data science) | -17637.9 | 34095.9 |
| Categorical(work_domain=databaser) | -41528.9 | 48109.9 |
| Categorical(work_domain=devops) | 30504 | 32890.5 |
| Categorical(work_domain=embedded/IOT/maskinvare) | 92335.7 | 43665.6 |
| Categorical(work_domain=frontend) | -9176.27 | 27464.8 |
| Categorical(work_domain=fullstack) | 1681.47 | 26120.8 |
| Categorical(work_domain=ingen av disse) | -165671 | 33303.4 |
| Categorical(work_domain=ledelse/administrativt) | 93721.4 | 29577 |
| Categorical(work_domain=programvare) | -39398.6 | 35485.2 |
| Categorical(work_domain=sikkerhet) | 28582.9 | 34913 |
| Categorical(work_domain=testing) | 24954.9 | 47410.7 |
| Intercept() | 903199 | 61478.3 |
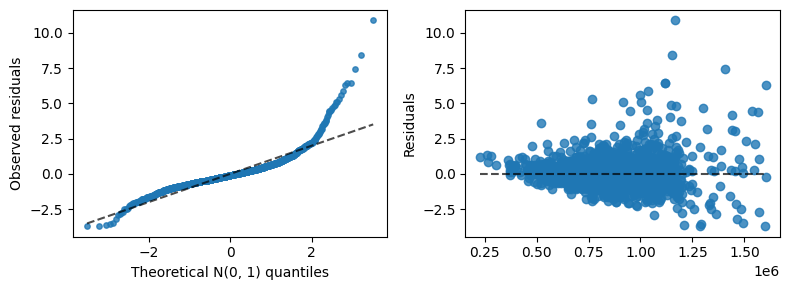
Inspect overall fit#
[10]:
from generalized_additive_models.inspection import QQDisplay, ResidualScatterDisplay

fig, (ax1, ax2) = plt.subplots(1, 2, figsize=(8, 3))

QQDisplay.from_estimator(model, df, y, ax=ax1)
ResidualScatterDisplay.from_estimator(model, df, y, ax=ax2)

fig.tight_layout()
plt.show()
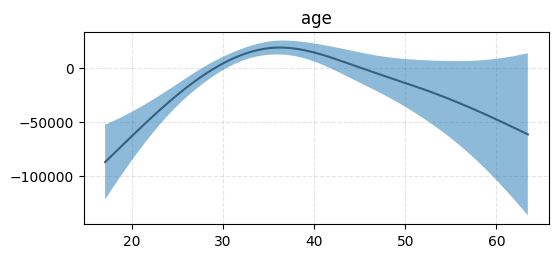
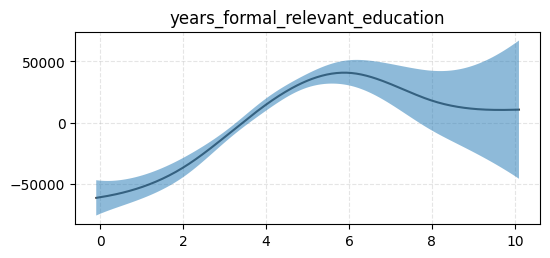
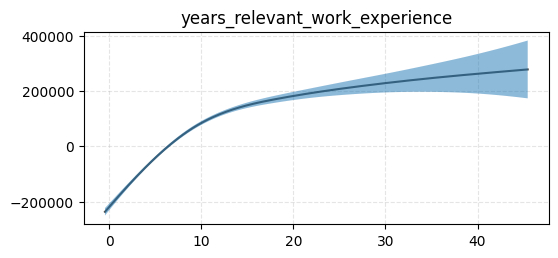
Inspect partial effects for spline features#
[11]:
from generalized_additive_models.inspection import PartialEffectDisplay


for term in model.terms:
    if not isinstance(term, Spline):
        continue

    fig, ax = plt.subplots(figsize=(6, 2.5))
    ax.set_title(term.feature)
    PartialEffectDisplay.from_estimator(model, term, df, y, ax=ax, rug=False)
    ax.grid(True, ls="--", zorder=0, alpha=0.33)
    plt.show()
Inspect categorical features#
[12]:
for term in model.terms:
    if not isinstance(term, Categorical):
        continue

    # Collect the information in a Series
    series = pd.Series(term.coef_, index=term.categories_).sort_values()

    # Create a horizontal bar plot
    fig, ax = plt.subplots(figsize=(6, 1 + 0.2 * len(series)))
    ax.set_title(term.feature)

    ticks = np.arange(len(series))
    ax.barh(ticks, series.values)
    ax.set_yticks(ticks)
    ax.set_yticklabels(series.index)
    ax.grid(True, ls="--", zorder=0, alpha=0.33)

    fig.tight_layout()
    plt.show()
[ ]: