Note
Go to the end to download the full example code.
Model comparison on salary dataset#
Plot four different models.
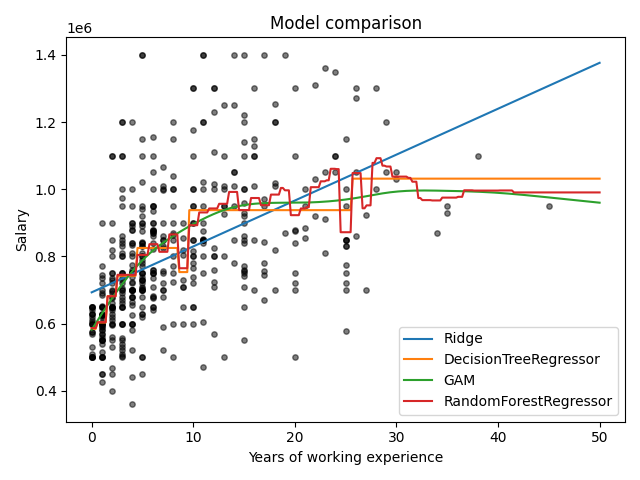
Ridge {'alpha': np.float64(359.38136638046257)}
DecisionTreeRegressor {'max_depth': 3}
GAM {'terms__penalty': np.float64(16.68100537200059)}
RandomForestRegressor {'max_depth': 5}
import matplotlib.pyplot as plt
import numpy as np
from generalized_additive_models import GAM, Spline
from generalized_additive_models.datasets import load_salaries
from sklearn.ensemble import RandomForestRegressor
from sklearn.linear_model import Ridge
from sklearn.model_selection import GridSearchCV
from sklearn.tree import DecisionTreeRegressor

# Load data
df = load_salaries().sample(500, random_state=42)

# Remove some outliers for prettier plotting
feature = "years_relevant_work_experience"
target = "salary"
df = df[(df[target] < 1.5e6)]

# Create data set for models
X = df[[feature]].values
y = df[target].values

# Four different models
models = [
    Ridge(alpha=1),
    DecisionTreeRegressor(max_depth=2),
    GAM(Spline(0, penalty=1)),
    RandomForestRegressor(max_depth=2),
]

param_grids = [
    {"alpha": np.logspace(-1, 3, num=10)},
    {"max_depth": [1, 2, 3, 4, 5, 6, 7]},
    {"terms__penalty": np.logspace(-1, 3, num=10)},
    {"max_depth": [1, 2, 3, 4, 5, 6, 7]},
]

# Smooth x-values for plotting
X_smooth = np.linspace(0, 50, num=2**8)[:, None]


# Create a 2x2 plot and loop over each axis
fig, ax = plt.subplots(1, 1)
ax.set_title("Model comparison")
ax.scatter(X, y, s=15, alpha=0.5, color="black")

for model, param_grid in zip(models, param_grids):
    name = type(model).__name__

    grid_search = GridSearchCV(model, param_grid, cv=5)
    grid_search.fit(X, y)
    print(name, grid_search.best_params_)

    ax.plot(X_smooth, grid_search.best_estimator_.predict(X_smooth), label=name)

plt.legend()
ax.set_xlabel("Years of working experience")
ax.set_ylabel("Salary")
plt.tight_layout()
plt.show()
Total running time of the script: (0 minutes 2.611 seconds)