Note
Go to the end to download the full example code.
Strength vs. Age#
Plot a Gaussian regression on a dataset with powerlifters. We use cross-validation to determine the optimal smoothing penalty.
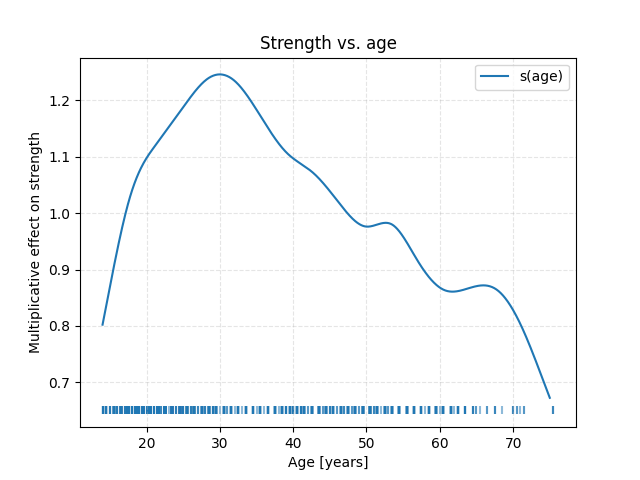
Optimal parameters: {'terms__0__penalty': np.float64(251188.6431509582)}
import matplotlib.pyplot as plt
import numpy as np
from generalized_additive_models import GAM, Categorical, Spline
from generalized_additive_models.datasets import load_powerlifters
from sklearn.metrics import make_scorer, mean_squared_error
from sklearn.model_selection import GridSearchCV, KFold

# Load data and filter it
df = load_powerlifters()

plt.title("Strength vs. age")

# Predict total weight lifted, given age, bodyweight and sex
terms = (
    Spline("age", penalty=1e4)
    + Spline("bodyweightkg", penalty=1e7)
    + Categorical("sex", penalty=1e4)
)
gam = GAM(terms=terms, distribution="normal", link="log")

# Cross validate to find penalty
cv = KFold(shuffle=True, random_state=42, n_splits=5)
scoring = make_scorer(mean_squared_error, greater_is_better=False)
param_grid = {"terms__0__penalty": np.logspace(5, 6, num=6)}
grid_search = GridSearchCV(gam, param_grid, cv=cv, scoring=scoring)
grid_search.fit(df, df["totalkg"])
print("Optimal parameters:", grid_search.best_params_)
gam = grid_search.best_estimator_

# Get the term for age, fitted with coefficients
age_term = gam.terms[0]
x_age = np.linspace(14, 75, num=2**10)
X_age_splines = age_term.fit_transform(x_age[:, None])

# Create predictions and plot them
prediction = np.exp(X_age_splines @ age_term.coef_)
plt.plot(x_age, prediction, label="s(age)")
plt.scatter(df["age"], np.zeros(len(df)) + 0.65, marker="|", alpha=0.5)

# Create a plot
plt.xlabel("Age [years]")
plt.ylabel("Multiplicative effect on strength")
plt.grid(True, ls="--", alpha=0.33)
plt.legend()
plt.show()
Total running time of the script: (0 minutes 1.130 seconds)