Note
Go to the end to download the full example code.
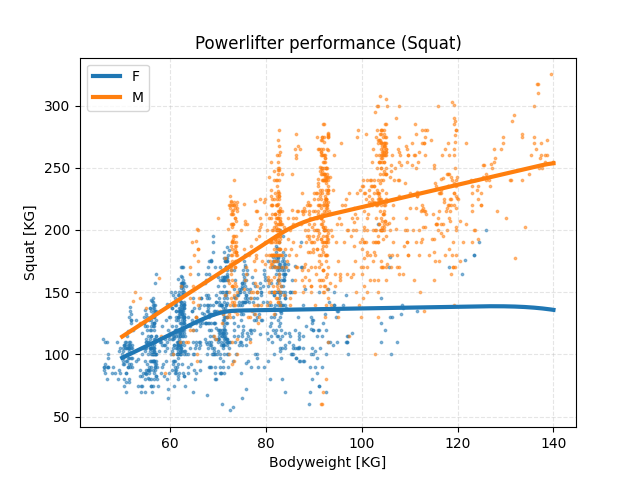
Strength vs. Bodyweight#
Plot a Gaussian regression on a dataset with powerlifters.
import matplotlib.pyplot as plt
import numpy as np
from generalized_additive_models import GAM, Spline
from generalized_additive_models.datasets import load_powerlifters

# Load data and filter it
df = load_powerlifters()
df = df[df.bodyweightkg <= 140]

plt.title("Powerlifter performance (Squat)")


for sex, df_sex in df.groupby("sex"):
    # Plot the data
    plt.scatter(df_sex["bodyweightkg"], df_sex["best3squatkg"], s=3, alpha=0.5)

    # Create a model
    terms = Spline(
        "bodyweightkg",
        constraint="increasing-concave",
        extrapolation="continue",
    )
    gam = GAM(terms=terms, distribution="normal", link="identity")
    gam.fit(df_sex, df_sex["best3squatkg"])

    # Plot Spline
    x_predict = np.linspace(50, 140, num=2**10)
    plt.plot(x_predict, gam.predict(x_predict[:, None]), lw=3, label=sex)

# Create a plot
plt.xlabel("Bodyweight [KG]")
plt.ylabel("Squat [KG]")
plt.grid(True, ls="--", alpha=0.33)
plt.legend()
plt.show()
Total running time of the script: (0 minutes 0.112 seconds)