Diagnostics plots#
Import packages.
[1]:
import matplotlib.pyplot as plt
import numpy as np
from sklearn.datasets import load_diabetes

from generalized_additive_models import GAM, Categorical, Spline
/home/docs/checkouts/readthedocs.org/user_builds/generalized-additive-models/envs/stable/lib/python3.11/site-packages/generalized_additive_models/__init__.py:116: UserWarning:
Thank you for using generalized-additive-models, version 0.4.3.
Until version 1.0.0 is released, the package and API should be considered unstable.
You are welcome to use the package. Report bugs and join the discussion on GitHub:
https://github.com/tommyod/generalized-additive-models
  warnings.warn(message)
Load data.
[2]:
data = load_diabetes(as_frame=True)
df = data.data
y = data.target

# Code the "sex" variable as strings
df = df.assign(sex=lambda df: np.where(df.sex < 0, "Male", "Female"))

df.sample(5)
[2]:
| age | sex | bmi | bp | s1 | s2 | s3 | s4 | s5 | s6 | |
|---|---|---|---|---|---|---|---|---|---|---|
| 84 | 0.001751 | Male | -0.039618 | -0.100934 | -0.029088 | -0.030124 | 0.044958 | -0.050195 | -0.068332 | -0.129483 |
| 138 | 0.034443 | Female | 0.111276 | 0.076958 | -0.031840 | -0.033881 | -0.021311 | -0.002592 | 0.028020 | 0.073480 |
| 175 | 0.067136 | Male | -0.038540 | -0.026328 | -0.031840 | -0.026366 | 0.008142 | -0.039493 | -0.027129 | 0.003064 |
| 241 | 0.030811 | Female | -0.008362 | 0.004658 | 0.014942 | 0.027496 | 0.008142 | -0.008127 | -0.029526 | 0.056912 |
| 22 | -0.085430 | Male | -0.004050 | -0.009113 | -0.002945 | 0.007767 | 0.022869 | -0.039493 | -0.061176 | -0.013504 |
[3]:
terms = Spline("age") + Spline("bmi") + Spline("bp") + Categorical("sex")
gam = GAM(terms).fit(df, y)
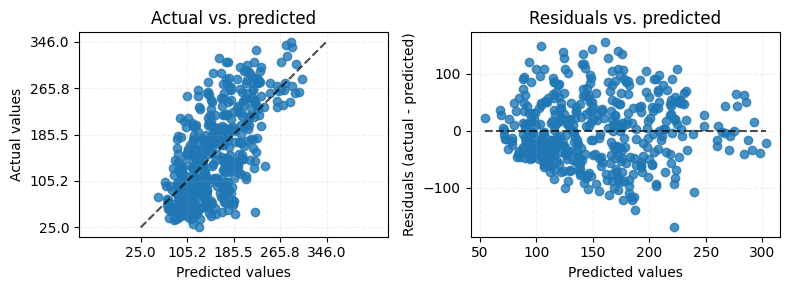
Diagnostics with sklearn#
[4]:
from sklearn.metrics import PredictionErrorDisplay

fig, (ax1, ax2) = plt.subplots(1, 2, figsize=(8, 3))

ax1.set_title("Actual vs. predicted")
PredictionErrorDisplay.from_estimator(gam, df, y, ax=ax1, kind="actual_vs_predicted")
ax1.grid(True, ls="--", alpha=0.2)

ax2.set_title("Residuals vs. predicted")
PredictionErrorDisplay.from_estimator(gam, df, y, ax=ax2, kind="residual_vs_predicted")
ax2.grid(True, ls="--", alpha=0.2)

fig.tight_layout()
plt.show()
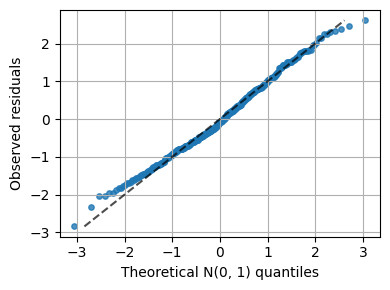
GAM diagnostics plots#
[5]:
from generalized_additive_models.inspection import QQDisplay


fig, ax = plt.subplots(1, 1, figsize=(4, 3))

display = QQDisplay.from_estimator(
    gam, df, y, residuals="deviance", method="normal", ax=ax
)

ax.grid(True)
fig.tight_layout()
plt.show()